The amount of information we are exposed to on any given day is astronomical. The number of societal problems we are asked to care about is equally overwhelming. To make sense of all of it, many of us reach for models — a clean number, a clear ratio, a tidy framework that organizes complexity into something we can act on. But every model that simplifies a complex reality is also making a choice about what to leave out, and those choices are not neutral. They determine what the model can see, what it cannot, and what conclusions it is even capable of producing.
In fields where our decisions shape what resources reach which communities — and where the very thing we are trying to measure resists easy quantification — we must be stringent about how we build and evaluate the models we rely on.
I was reminded of this recently during a graduate-level library science course where the class was shown the Diversity in Children’s Books 2018 infographic (Huyck & Park Dahlen, 2019). The graphic illustrates that children from various backgrounds hold mirrors of different sizes, reflecting how frequently characters like them appear in children’s books. The numbers sit beneath them: White: 50%. Animals/Other: 27%. African/African American: 10%. Asian Pacific Islander: 7%. Latinx: 5%. American Indians/First Nations: 1%.
There is a familiar move that tends to emerge around data like this. If you line up each group’s share of books against its share of the U.S. population, the numbers can be made to look almost comforting. From there, it becomes easy to conclude that diversity in children’s publishing is largely not a problem.
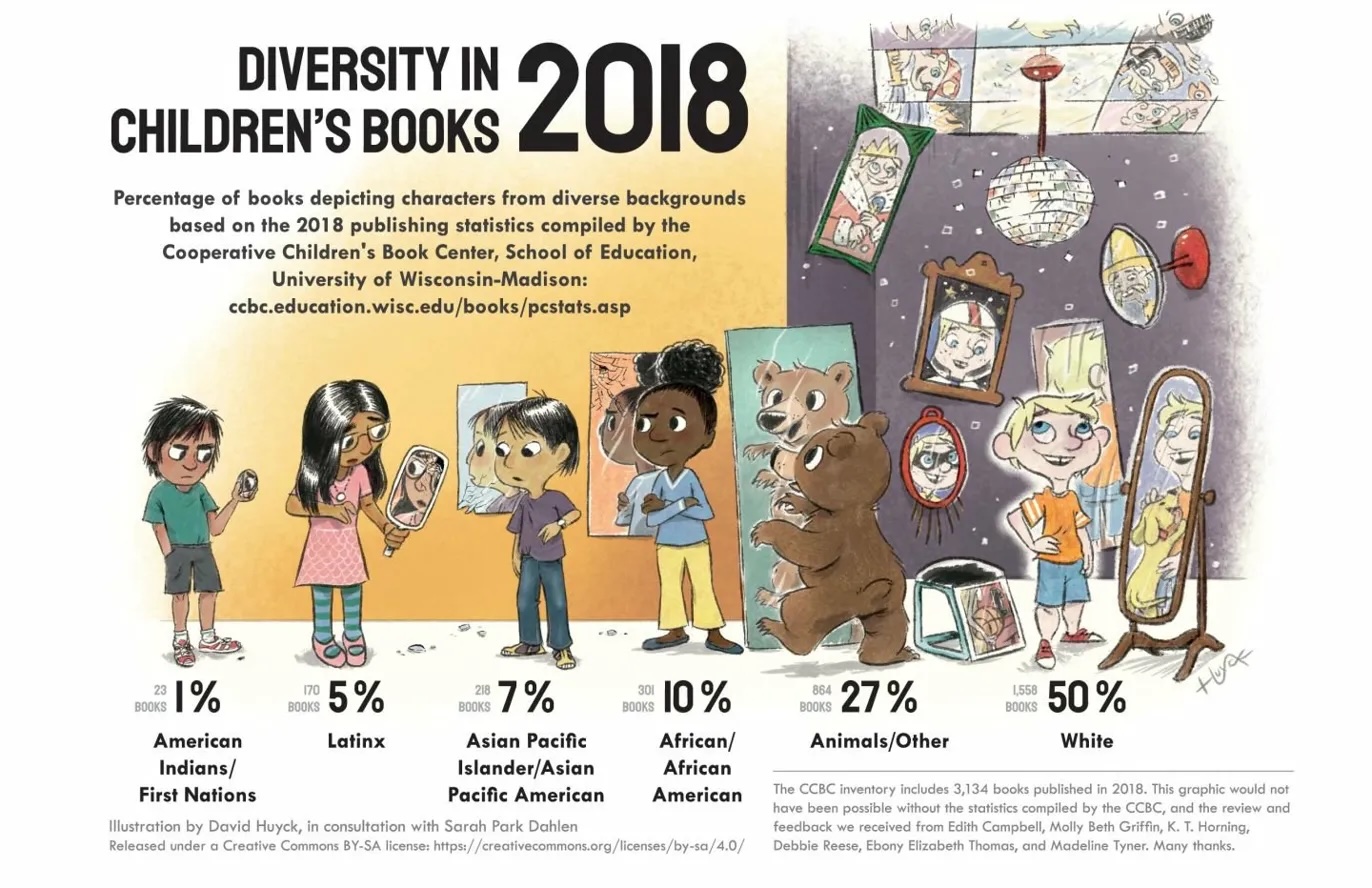
Figure 1. Diversity in Children’s Books 2018. Huyck & Park Dahlen, 2019.
This is the spherical cow problem.
In physics, there is a classic joke about a dairy farmer who asks a theoretical physicist to help improve milk production. The physicist studies the problem carefully and begins: “First, assume the cow is a sphere…” Everything that makes the cow a cow is set aside — its limbs, its shape, its uneven surface. The humor is the point. The simplification that makes the math tractable also makes the answer useless, because real cows are not spheres, and real representation is not a headcount.
Applying a proportionality ratio to this data is exactly that kind of oversimplification. The Huyck and Park Dahlen infographic was trying to capture whether children from all backgrounds have access to what Rudine Sims Bishop called mirrors — books that reflect their own lives and experiences back to them with accuracy and dignity. When a proportionality ratio is applied, the cracked mirrors count the same as the whole ones. The background character counts the same as the protagonist.
There are three specific modeling problems worth examining in detail.
A. Presence Is Not the Same as Narrative Weight
The mere presence of a diverse character does not mean that character has narrative agency, depth, or a story that belongs to them. A better measure would use a weighted approach. Instead of measuring diversity as a simple ratio:
A weighted model assigns value by narrative role — protagonist = 1.0, co-lead = 0.5, minor or background character = 0.1 — and calculates representation as:
Table 1 — Simple Ratio vs. Weighted Share
| Group | Book presence | R(g) | Protagonist | Co-lead | Background | Weighted share |
|---|---|---|---|---|---|---|
| White | 60 | 0.60 | 40 | 10 | 10 | 0.637 |
| Latinx | 15 | 0.15 | 2 | 3 | 10 | 0.066 |
| Black | 23 | 0.23 | 10 | 5 | 8 | 0.196 |
| Asian | 15 | 0.15 | 5 | 4 | 6 | 0.121 |
| Indigenous | 5 | 0.05 | 1 | 1 | 3 | 0.026 |
Hypothetical collection of 100 books. Latinx and Asian children share an identical R(g) of 0.15 — yet their weighted shares diverge sharply once narrative role is factored in. Protagonist = 1.0, co-lead = 0.5, background = 0.1.
Proportional ratios can look fair on paper while narrative power remains deeply uneven in practice.
B. Individual Ratios Do Not Reveal Systemic Imbalance
A parity score of 1.0 is the baseline: the point at which a group’s share of books matches their share of the population exactly. To surface systemic skew, you calculate the gap for each group and sum them:
If you were measuring how evenly water fills five containers, you would not just check whether one container is full. You would look at all five together and ask how far the whole set is from level. The gap measure does exactly that for representation.
Table 2 — Gap from Parity, Huyck & Park Dahlen 2018 data
| Group | Book share | Population share | Gap | Direction |
|---|---|---|---|---|
| White | 68.6% | 57.8% | +10.8 | Above parity |
| Latinx | 7.5% | 18.7% | −11.2 | Below parity |
| Black | 13.3% | 12.1% | +1.2 | Near parity |
| Asian | 9.6% | 6.1% | +3.5 | Near parity |
| Indigenous | 1.0% | 0.7% | +0.3 | Near parity |
| Total gap | 27.0 percentage points | |||
Book counts drawn from the Huyck & Park Dahlen (2019) infographic. Animals/Other excluded; 2,270 books across five groups. Population share from 2020 U.S. Census. Near parity = within ±3 percentage points.
A total gap of 27 percentage points means the distribution of children’s books sits substantially far from where a proportional system would place it.
C. Combining Categories Masks Imbalance
A common move in diversity reporting is to present results as a simple two-category comparison: White children on one side, all other groups combined on the other. The math produces a single ratio that looks almost tolerable. It is not a description of any group’s actual situation — it is an average of vastly different situations, produced by adding all minority groups together and quietly absorbing any underrepresentation in the aggregate.
Table 3 — The Cancellation Effect
| Group | Book presence | Book share | Population share | R(g) |
|---|---|---|---|---|
| White | 1,558 | 68.6% | 57.8% | 1.19 |
| Non-White (combined) | 712 | 31.4% | 37.6% | 0.83 |
The combined R(g) of 0.83 suggests modest uniform underrepresentation. It describes no group’s actual situation.
This is how modeling choices shape conclusions
Equal weighting treats background characters as protagonists. The infographic was doing exactly what it was designed to do: make a disparity visible. The problem enters when a proportionality ratio gets layered on top and used to argue the disparity is not actually a problem.
Individual ratios obscure the systemic picture. A collection of ratios that each look tolerable can still describe a distribution that is deeply skewed. The total gap measure surfaces what no individual ratio can.
Aggregation allows overrepresentation to absorb underrepresentation. This is how well-intentioned analysis becomes cover for inaction, and how deliberate misrepresentation finds a clean mathematical disguise. The numbers do not lie, but the framework around them can — and often does.
What This Means for Librarians
For librarians, none of this is abstract. Every collection development decision is a modeling decision, whether we name it that or not. When we accept a simple headcount as sufficient evidence that our shelves are serving all children equally, we are choosing a model. When we aggregate categories that obscure which children are missing, we are choosing a model. And when we allow a ratio that looks tolerable to stand in for an honest reckoning with the full distribution, we are choosing a model that tells us what we might prefer to hear.
Rigorous measurement is not a technical nicety. It is an act of accountability. Asking whether a group appears in books is a different question from asking whether they drive the story. Asking whether individual ratios look reasonable is a different question from asking how far the whole system sits from parity. And reporting a combined category that lands near 1.0 is a different thing entirely from reporting what is actually happening to each group inside that number.
The data we choose to trust shapes the shelves we build, and the shelves we build shape which children walk into a library and find someone who looks like them at the center of a story.
The children in our communities deserve better than a model that tells us what we might prefer to hear.
on measurement, representation, and the models we choose